Uptime Report
The Uptime Report provides uptime statistics over a selected time period, 7 days is the default when first opened.
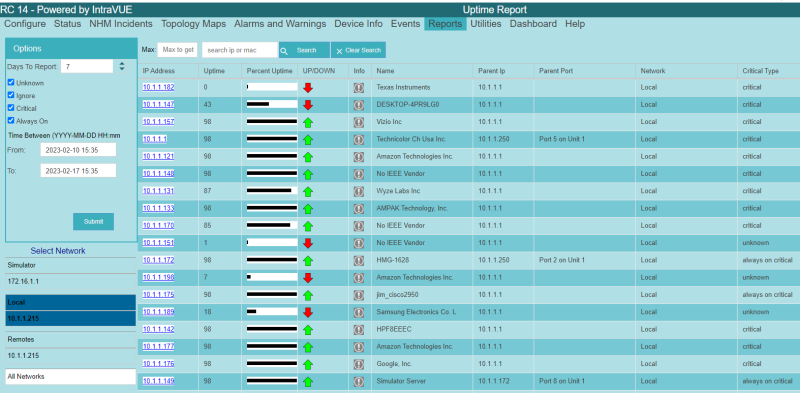
You can select the period for the report by changing the number of Days To Report. Changing the days will change the date/times in the From and To fields. You may also directly change dates in the From/To fields to anything needed. The report uses the From/To fields for its data.
You can select the Critical Types to display, the most interesting choice is to show just the Alway On critical devices.
The Up/Down column indicates if the device is currently connected or disconnected.
You can select an individual Network or All Networks for the report.
| Introduction |
|
| Key Features and Benefits |
|
| Getting Started |
|
| Update Intravue |
|
| Notes on User Interface |
|
| Configuration |
|
| Connecting to an IntraVUE |
|
| WBC Network Health Monitor Settings |
|
| Email Settings |
|
| Database Settings |
|
| Real-Time IntraVUE Management |
|
| IntraVUE Status |
|
| IntraVUE Dashboard |
|
| Summary Statistics |
|
| Highest Ping Response Devices |
|
| Highest Bandwidth Devices |
|
| Uptime and Statistics |
|
| Hypertree Network Map |
|
| Tree View Network Map |
|
| Reports |
|
| Device Info |
|
| Alarms and Warnings |
|
| Events |
|
| Threshold Analysis and Configuration Report |
|
| Time Based CRC and IfInErrors Report |
|
| Connection History Report |
|
| 1 Week Disconnected Devices Report |
|
| Disconnections by Minute Chart |
|
| Ping Failures by Minute Chart |
|
| Switchprobe (analysis) Reports |
|
| Utilities |
|
| Device Editor |
|
| KPI Management |
|
| Create a 'clean' database with existing ranges |
|
| Vendor Name Management |
|
| DeviceInfo Popup |
|